Openshift Log Aggregation And Analysis using Splunk
Splunk is one of popular tools we use to analyze log files. In this post I would describe how to configure an openshift cluster to send all of the platform log files (mind that this excludes gear log files) to Splunk.
As root, create an /etc/rsyslog.d/forward.conf file as follows (change splunkserver to your splunk server IP, and the @@ means TCP, instead of @ for UDP)
$WorkDirectory /var/lib/rsyslog # where to place spool files
$ActionQueueFileName fwdRule1 # unique name prefix for spool files
$ActionQueueMaxDiskSpace 1g # 1gb space limit (use as much as possible)
$ActionQueueSaveOnShutdown on # save messages to disk on shutdown
$ActionQueueType LinkedList # run asynchronously
$ActionResumeRetryCount -1 # infinite retries if host is down
*.* @@splunkserver:10514
And I don't want watchman metrics to fill up local log files, so I discard the metrics before writing to local file. Edit /etc/rsyslog.conf :
#kern.* /dev/console
:msg, contains, "type=metric" ~
# Log anything (except mail) of level info or higher.
# Don't log private authentication messages!
*.info;mail.none;authpriv.none;cron.none /var/log/messages
And in my system SElinux block the rsyslog remote connect activity, so we need to enable allow_ypbind :
setsebool -P allow_ypbind 1
Restart the rsyslog system
service rsyslog stop
service rsyslog start

Configure Splunk to listen on TCP port
From splunk web console home, choose 'Add Data', 'monitor', 'TCP/UDP', fill in port 10514 (TCP), click 'Next', select sourcetype Operating System - linux_messages_syslog.Configure Rsyslog Forwarding
These steps should be done in every openshift node, openshift broker and console.As root, create an /etc/rsyslog.d/forward.conf file as follows (change splunkserver to your splunk server IP, and the @@ means TCP, instead of @ for UDP)
$WorkDirectory /var/lib/rsyslog # where to place spool files
$ActionQueueFileName fwdRule1 # unique name prefix for spool files
$ActionQueueMaxDiskSpace 1g # 1gb space limit (use as much as possible)
$ActionQueueSaveOnShutdown on # save messages to disk on shutdown
$ActionQueueType LinkedList # run asynchronously
$ActionResumeRetryCount -1 # infinite retries if host is down
*.* @@splunkserver:10514
And I don't want watchman metrics to fill up local log files, so I discard the metrics before writing to local file. Edit /etc/rsyslog.conf :
#kern.* /dev/console
:msg, contains, "type=metric" ~
# Log anything (except mail) of level info or higher.
# Don't log private authentication messages!
*.info;mail.none;authpriv.none;cron.none /var/log/messages
And in my system SElinux block the rsyslog remote connect activity, so we need to enable allow_ypbind :
setsebool -P allow_ypbind 1
Restart the rsyslog system
service rsyslog stop
service rsyslog start
Configure Node Logging
Edit the /etc/openshift/node.conf and add these lines if they haven't already existed:
PLATFORM_LOG_CONTEXT_ENABLED=1
PLATFORM_LOG_CONTEXT_ATTRS=request_id,container_uuid,app_uuid
PLATFORM_LOG_CLASS=SyslogLogger
# enable metrics, beware of log volume increase
WATCHMAN_METRICS_ENABLED=true
# select fewer metrics
CGROUPS_METRICS_KEYS="cpu.stat,cpuacct.stat,memory.usage_in_bytes"
Restart the mcollective service.
service ruby193-mcollective stop
service ruby193-mcollective start
Configure Broker Logging
Edit the /etc/openshift/broker.conf and add this line :
SYSLOG_ENABLED=true
Restart broker
service openshift-broker stop
service openshift-broker start
Configure Web Console Logging
Edit the /etc/openshift/console.conf and add this line :
SYSLOG_ENABLED=true
Restart the web console
service openshift-console stop
service openshift-console start
Epilog
We could analyze, for example, gear memory usage :
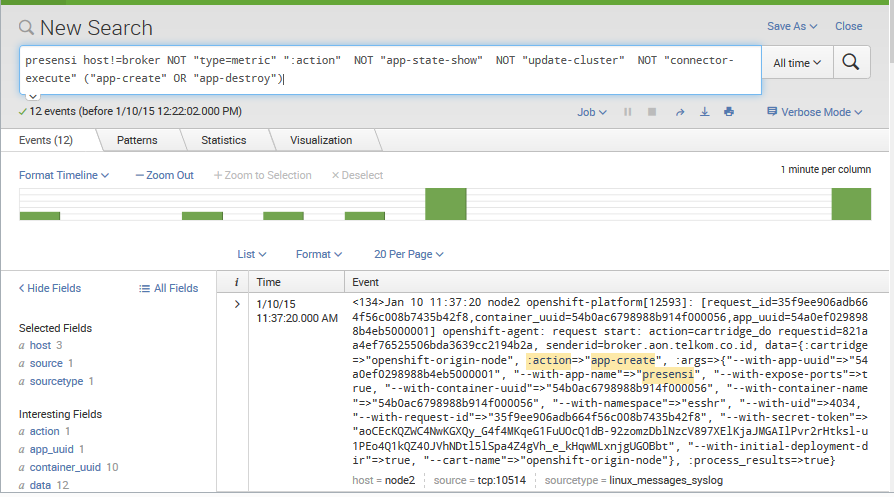
And gear create/destroy activities :

Comments