Posts

Showing posts from 2020

Connect XBox 360 Wireless Controller to your Nintendo Switch
Image
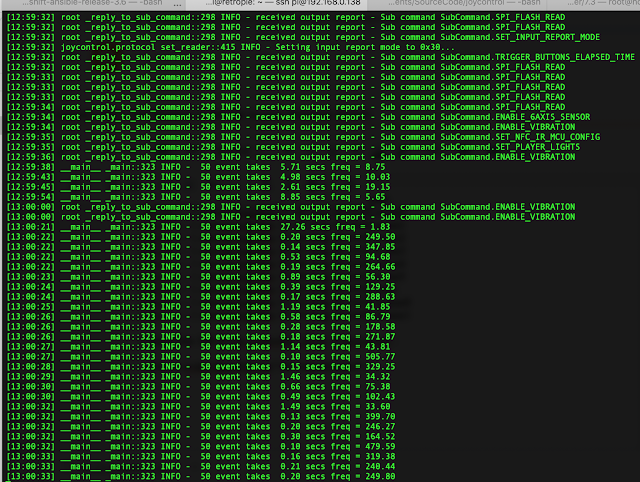
Nintendo Switch's default controller is good enough for gaming, but unfortunately after a while  the joycons would drift easily. As an alternative, this article will show how to use XBox 360 wireless controller (or any controller that are detectable by Linux OS) to control a Nintentdo Switch Console Hardware Needed A. https://www.ebay.com/b/xbox-360-controller-pc-adapter/bn_7024868184 First you need a Xbox 360 to PC adapter. B.  https://www.ebay.com/itm/Raspberry-Pi-3-Model-B-Plus-1-4GHz-Quad-Core-64Bit-1GB-RAM-2018-Model-/261698200759 And a raspberry PI model 3B+. With a SD card containing Raspbian OS. C.  https://www.ebay.com/itm/xbox-360-controller-wireless-new/153989068162?hash=item23da76b582:g:bVQAAOSwsJFe-zPz A Xbox  360 wireless controller. D. And of course we also need a Nintendo Switch Console. Fortunately I have all these items in my home. If you don't have A and B, you might better off just buy Mayflash Magic NS adapter ( https://www.amazon.com/Mayflash-

Demistifying Certificate Generation using Ansible in Openshift

Image
Background Ansible is the only available tools to manage deployment Openshift Origin Clusters, now known OKD. Some pitfalls were identified when the author tried to redeploy certificate in an Origin 3.6 cluster. Logging Issues We were trying to do some troubleshooting using the kibana-ops logging console, and were surprised to find it not working. Quick check on the logging project shows that many of the pods have warning status. Checking these pods (mostly elasticsearch instances) we found that the the health check script results in 'Elasticsearch node is not ready to accept HTTP requests yet' with http response code 000. The pods were at 90% storage, which I think caused by the curator unable to connect to the elastic instances (The curator is supposed to clean old index data files so the disk won't fill up).  Further investigation results the curl command (adapted from this syntax from the chapter Aggregating Container Logs - Performing Administrative Elasticsearch Oper

Tips on Recovering from Out of Disk Space (Linux Server)

Background When multiple VM is being used for application infrastructure,  sooner or later a system administrator will face out of disk space condition. This post will show a few selected approach to resolve such condition. First Step : Identify The Disk Configuration Some commands to determine disk mounting configuration : determine disk usage and mount points : df -h detailed mount point and options : mount | column -t physical volumes for LVM : pvs logical volumes for LVM : lvs volume group for LVM : vgs block devices list : lsblk Some VM might use ZFS on Linux, to examine pool configurations use : zfs list zpool list zfs list -t snapshot Second step : Determine which directory are using most space From the df -h command, we found out which partition or mount point is at out of disk space condition or nearing it. Better way to determine which directory are the largest is using ncdu tool, but if you didn't have it installed you could always use du -hs /<path>/*. For example

Notes on Learning Open VSwitch in Openshift OKD

Background Open VSwitch or ovs is the software that openshift used to ensure pods in the openshift cluster could talk to each other using cluster-internal IP addresses. In default settings, hosts outside the cluster are not be able to connect directly to pods; and haproxy (running in  'openshift router' pods) sofware listening on host port is doing the work of distributing http request into each and every application's pods.  In order to follow this blog post you will need root-level OS access on the hosts / openshift nodes, so it is geared towards system administrator of the openshift platform, not the casual application developer. Examining OVS bridge [root@node3 ~]# ovs-vsctl list-br br0 So we know the OVS bridge is named br0. [root@node1 ~]# ovs-ofctl -O OpenFlow13 dump-ports-desc br0 OFPST_PORT_DESC reply (OF1.3) (xid=0x2):  1(vxlan0): addr:62:b2:af:23:90:ea      config:     0      state:      0      speed: 0 Mbps now, 0 Mbps max  2(tun0): addr:b2:23:c3:0f:e4:56      c

How to show clusterwide utilization in Openshift/Kubernetes

Background When deploying openshift/kubernetes cluster in production, usually we used more than 3 machine/hosts, and in my company's deployment we used more than 10 VMs. Monitoring resource usage in multiple VM is nothing new but using kubernetes we have an option to use kubectl / oc adm top nodes to do this. Using kubectl/ oc adm top nodes will show overall CPU and memory usage for each node The old ways (pre-kubernetes) Before using kubernetes/openshift, we used RHEL/CentOS VMs and to get resource usage we use the sar utility. Of course we need to install sar first (sudo  yum install sysstat) , and then sar is quite unique that it store historical data based on the date of the month.   To get cpu usage for current date : sar To get memory usage for current date : sar -r To get memory usage for the date 30 : sar -r -f /var/log/sa/sa30 To get cpu usage for the date 30 : sar -f /var/log/sa/sa30 There are other interesting resource usage such as per core cpu usage (sar -P ALL), block

Debugging Web Services in Netweaver ABAP Server

Image
When running an application in the server, sometimes things doesn't goes the way it supposed to be, and we need to debug the application. For desktop application based on Java or .NET technology, it is just a matter of setting the breakpoint in IDE and then running the application with debug enabled. For web application based on ASP.NET, similar thing could be done by using Visual Studio and running the web application in debug mode using IIS Express. But what about web services that being served by SAP Netweaver AS ? This post shows how. Option 1. Execute - Debugging in SE37 This is the most standard way to debug ABAP remote function module. Just open up transaction SE37, type function module name, and click on the caliper icon  (For those who are not so into STEM stuffs, you could see this wiki page to know about calipers). Then fill in the input parameters before clicking on the Execute - Debugging icon. Now you are inside the ABAP debugger, and